A major aim of IDD prevention programmes is to reduce the prevalence and incidence of thyroid diseases and consequently decrease their burden on health-care systems. EUthyroid addresses this challenge through standardising national and regional IDD monitoring studies and harmonising the data.
National and regional data from single studies were pooled and analysed to establish a valid map of iodine status in Europe and to create an overview of the regional prevalence patterns of thyroid related biomarkers and thyroid dysfunction.
Iodine status in Europe
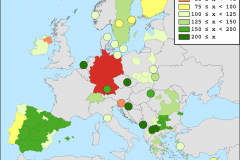
European Map of harmonised Iodine Status
| Iodine (µg/l) | |
|---|---|
| x < 50 | |
| 50 ≤ x < 75 | |
| 75 ≤ x < 100 | |
| 100 ≤ x < 125 | |
| 125 ≤ x < 150 | |
| 150 ≤ x < 200 | |
| 200 ≤ x | |
Source of Administrative boundaries: European Boundary Map (EBM) v9.1, EuroGeographics (2015), The Global Administrative Unit Layers (GAUL) dataset, implemented by FAO within the CountrySTAT and Agricultural Market Information System (AMIS) projects. The data sets are slightly modified by UMG/SHIP (reduced number of points per polygon).
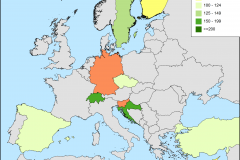
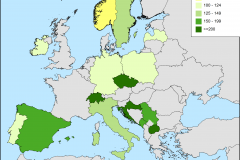
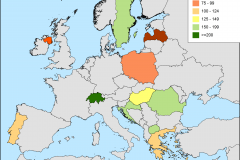
The iodine status of regions is assessed by median urinary iodine concentration (UIC) determined in representative samples of the general population or target population. Data from 53 monitoring studies were uploaded to EUthyroid DEX. A total of 51 studies had UIC measured of which 23 of those were conducted in children, 14 in adults and 14 in pregnant women. The central EUthyroid laboratory in Helsinki (THL) received urine samples from 23 studies and 39 studies could be harmonised for UIC measurement using the conversion formulas established through statistical analysis at UMG. Iodine status is presented based on the actual study region. If more than one study was conducted in one study region the following prioritization was used: IDD monitoring studies in children were preferred over adults, which were preferred of pregnant women. In study regions/countries with multiple IDD monitoring studies of the same subpopulation the most recent was preferred. For a detailed description on the lab methods and statistical analysis, please go to:
> Laboratory method and statistical analysis for cross-lab comparison
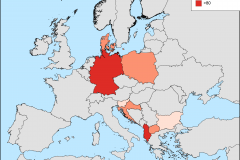
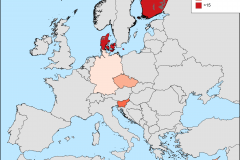
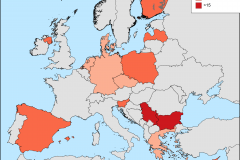
Detailed maps of iodine status of subpopulations
Regional prevalence patterns of thyroid related biomarkers and thyroid dysfunction
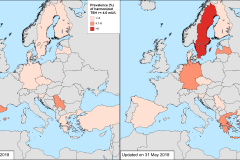
In order to create an overview of the regional prevalence patterns of thyroid related biomarkers and thyroid dysfunction, regional and national monitoring data as well as registry data were standardised. Harmonised low and high TSH were defined using the reference limits 0.4 mU/L and 4.0 mU/L. Prevalence of low TSH ranged between 0.0% and 6.8% whereas prevalence of high TSH ranged between 0.5% and 6.7%. Enlarged thyroid volume was defined using the cut-offs of >18 ml in females and >25 ml in males (Gutekunst et. al., 1993). For children, we used the WHO-recommended cut-offs as recommended by Zimmermann et al. in 2004. Prevalence of enlarged thyroid volumes ranged from 8.0% to 23.2%. Increased TPO-Abs and increased Tg-Abs were defined using cut-offs from the respective manufacturer. Prevalence for increased TPO-Abs and Tg-Abs ranged from 6.0% to 19.2% and from 3.7% to 19.9% respectively. Furthermore, it was possible to retrieve the prevalence of hyper- and hypothyroidism as well as the prevalence of goitre from the registry data provided by 13 countries.
Prevalence maps
Thyroid related biomarkers retrieved from monitoring data
